summarize_missing_values(): Summarize and visualize missing values in a DataFrame
Description
This function provides a quick summary of missing data in a DataFrame and optionally visualizes it. It reports both per-column and per-row missingness and offers two visualization modes: a matrix view and a bar chart. This helps users diagnose data quality issues before sequence analysis.
Usage
summarize_missing_values(
    df,
    plot=True,
    top_n=5,
    columns=None,
    mode='matrix',
    figsize=(10, 5),
    save_as=None,
    show=True
)
Note: The values shown above are default settings. You can change them depending on your needs. For example:
- To only analyze certain columns: set
columns=['col1', 'col2']- To switch to a bar chart: set
mode='bar'- To save the plot as a PNG image: set
save_as='my_plot.png'- To suppress the plot display (e.g., in a script): set
show=False
Here's a quick example with customization:
summarize_missing_values(
    df,
    plot=True,
    mode='bar',
    columns=['Age', 'Income'],
    save_as='missing_summary.png',
    show=False
)
This would:
- Focus only on the
AgeandIncomecolumns - Use a bar chart instead of the default matrix
- Save the figure as
missing_summary.png - Avoid popping up the plot window (e.g., in automated scripts)
Entry Parameters
| Argument | Type | Description |
|---|---|---|
df | pd.DataFrame | The input DataFrame to be analyzed. |
plot | bool | Whether to generate a visual plot of missing values. Default is True. |
top_n | int | Number of rows with the most missing values to display. Default is 5. |
columns | list or None | Optional list of columns to include in the analysis. If None, all columns are used. |
mode | 'matrix' or 'bar' | Type of plot to show: "matrix" (default) for a time-like layout, or "bar" for per-column summary. |
figsize | tuple | Size of the plot in inches. Default is (10, 5). |
save_as | str or None | File path to save the figure. If None, the figure is not saved. |
show | bool | Whether to display the plot. If False, the figure will be created but not shown. |
Details
The function performs three tasks:
Column summary: Lists how many values are missing per column and their percentage.
Row summary: Identifies rows with the most missing values.
Visualization:
"matrix"view (default) shows missing patterns across rows, useful for sequence-shaped data."bar"view shows how many values are missing per column.
Optionally, users can limit the analysis to selected columns, save plots to disk, and suppress display for batch processing.
Value
This function prints summaries and optionally generates a visual plot. It does not return a value (i.e., it returns None).
Examples
import pandas as pd
from sequenzo.data_preprocessing.helpers import summarize_missing_values

df = pd.DataFrame({
    'A': [1, None, 3, None],
    'B': [None, 2, None, 4],
    'C': [5, 6, 7, 8]
})# 1. Basic summary with default matrix plot
summarize_missing_values(df)# 2. Only summarize specific columns
summarize_missing_values(df, columns=['A', 'B'])# 3. Save plot and use bar mode
summarize_missing_values(df, mode='bar', save_as='missing_bar.png', show=False)# 4. Only the textual summary of missing values is printed
summarize_missing_values(df, plot=False)# 5. Changes the figure size
summarize_missing_values(df, figsize=(12, 6))# 6. Focus on selected columns
summarize_missing_values(df, columns=['A'], show=False)Output
summarize_missing_values(df):
🔍 Missing Value Summary
----------------------------------------
[Columns with Missing Values]
   Missing Count  Missing (%)
A              2         50.0
B              2         50.0

[Top 5 Rows with Most Missing Values]
   Missing Count
0              1
1              1
2              1
3              1
<Figure size 1000x500 with 0 Axes>
summarize_missing_values(df, columns=['A', 'B']):
🔍 Missing Value Summary
----------------------------------------
[Columns with Missing Values]
Missing Count  Missing (%)
A              2         50.0
B              2         50.0

[Top 5 Rows with Most Missing Values]
Missing Count
0              1
1              1
2              1
3              1

<Figure size 1000x500 with 0 Axes>
summarize_missing_values(df, mode='bar', save_as='missing_bar.png', show=False):
🔍 Missing Value Summary
----------------------------------------
[Columns with Missing Values]
Missing Count  Missing (%)
A              2         50.0
B              2         50.0

[Top 5 Rows with Most Missing Values]
Missing Count
0              1
1              1
2              1
3 1- Because
show=False, the plot is not displayed. - Because
save_as='missing_bar.png', the plot is saved to disk instead of shown on screen.
The plot image is saved in the file as follow: 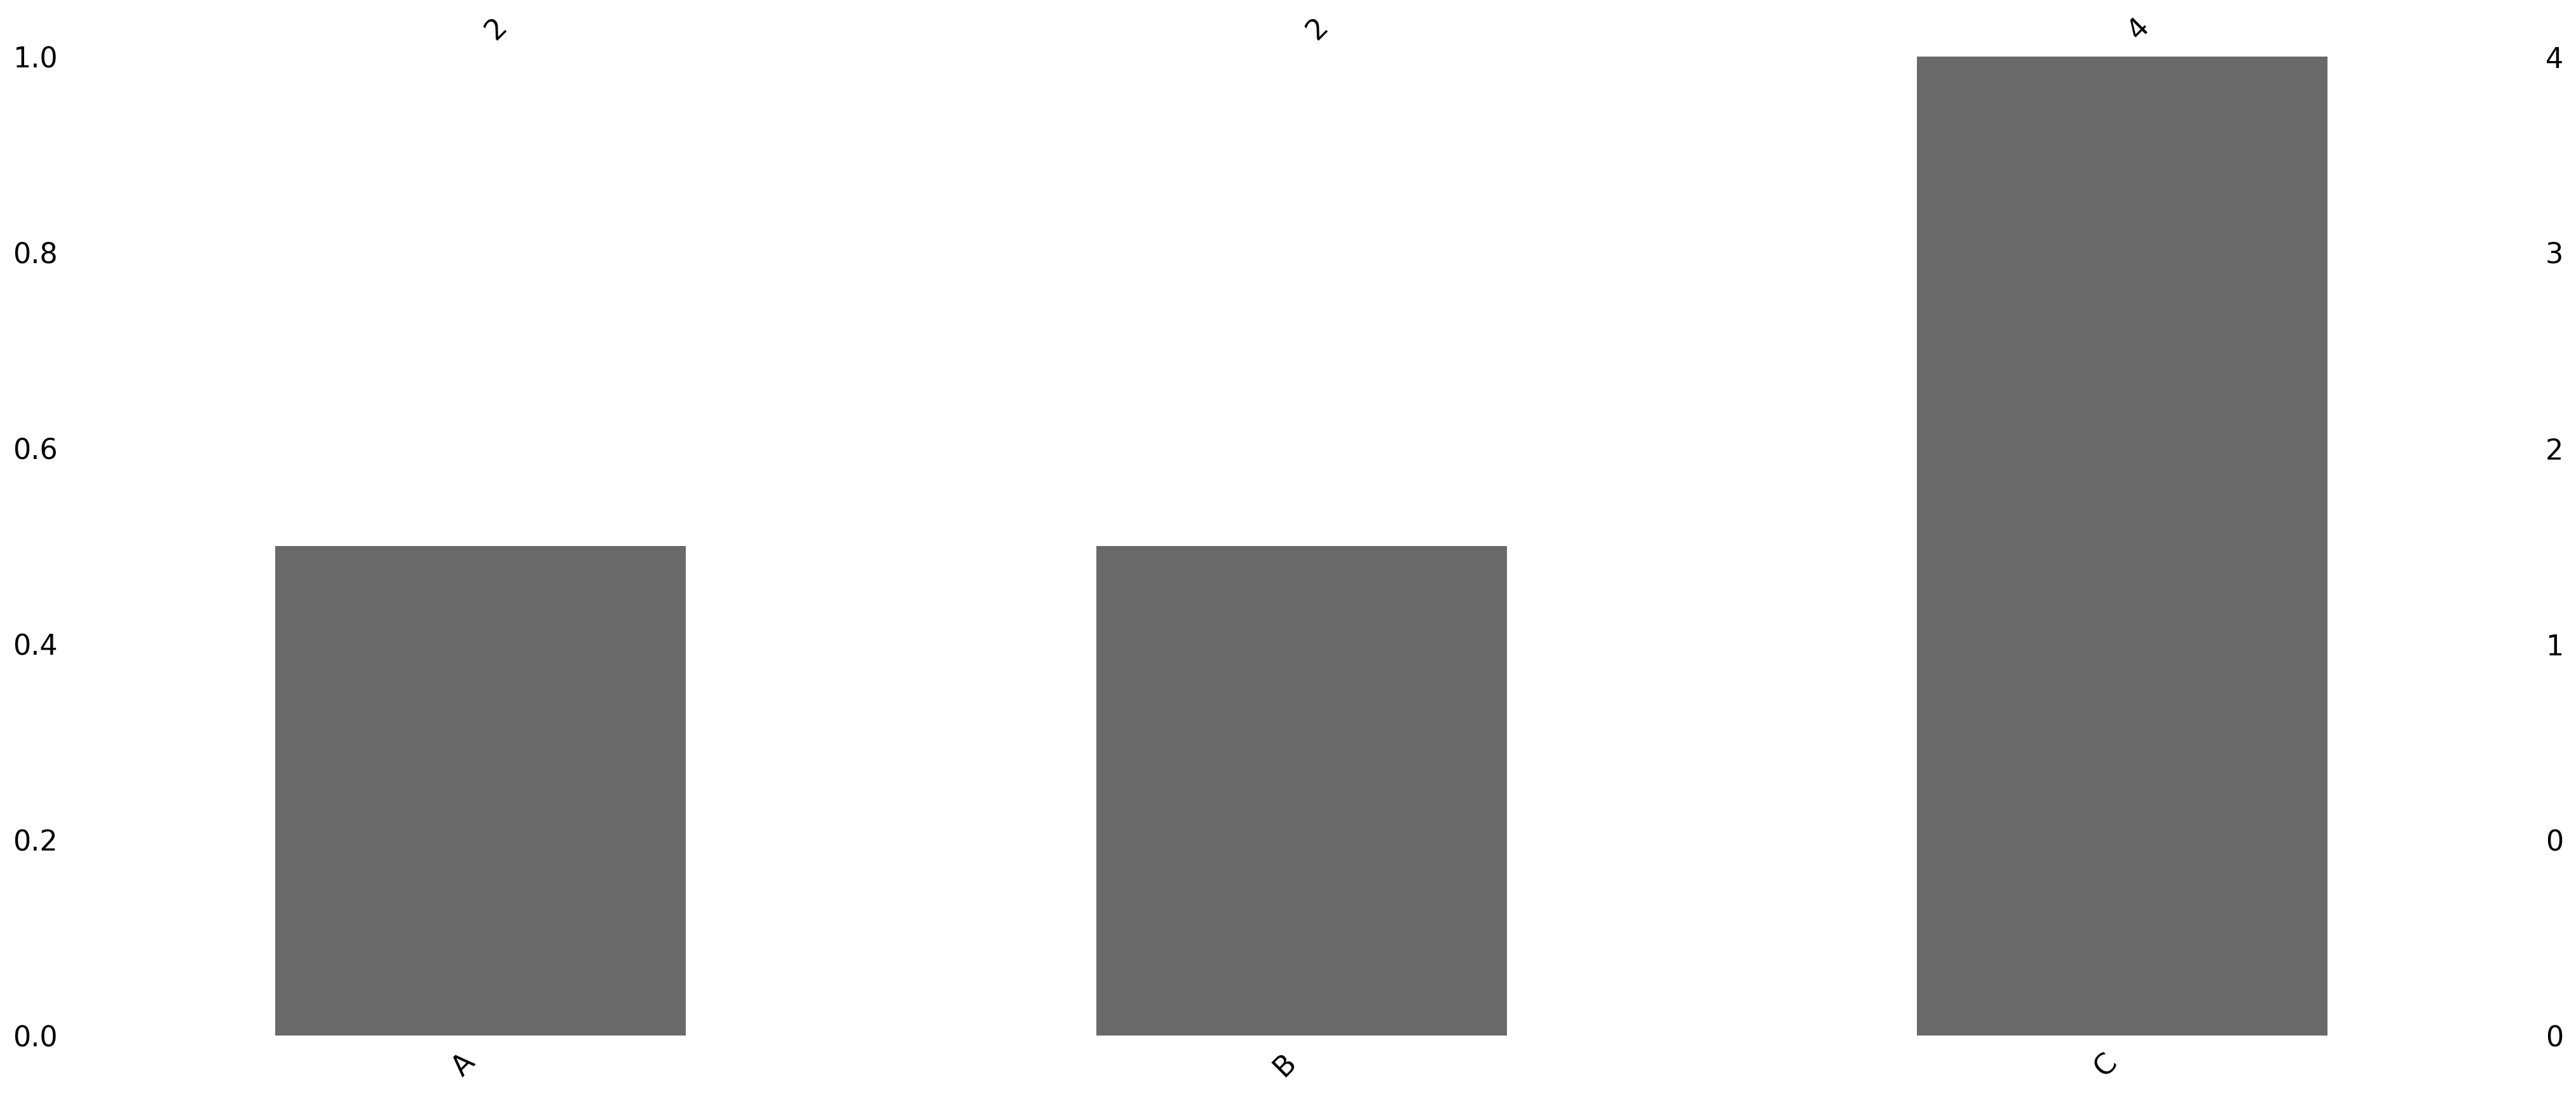
summarize_missing_values(df, plot=False)
🔍 Missing Value Summary
----------------------------------------
[Columns with Missing Values]
   Missing Count  Missing (%)
A              2         50.0
B              2         50.0

[Top 5 Rows with Most Missing Values]
   Missing Count
0              1
1              1
2              1
3              1
Also since show=False, the plot is not displayed.
summarize_missing_values(df, figsize=(12, 6))
🔍 Missing Value Summary
----------------------------------------
[Columns with Missing Values]
   Missing Count  Missing (%)
A              2         50.0
B              2         50.0

[Top 5 Rows with Most Missing Values]
   Missing Count
0              1
1              1
2              1
3              1

<Figure size 1200x600 with 0 Axes>
summarize_missing_values(df, columns=['A'])
🔍 Missing Value Summary
----------------------------------------
[Columns with Missing Values]
Missing Count  Missing (%)
A              2         50.0

[Top 5 Rows with Most Missing Values]
Missing Count
1              1
3              1
0              0
2              0

<Figure size 1000x500 with 0 Axes>
Authors
Code: Yuqi Liang
Documentation: Yuqi Liang
Edited by: Yuqi Liang
Translation and testing by: Sizhu Qu