ClusterResults(): Export, Summarize, and Visualize Cluster Memberships
Once you have fitted a hierarchical clustering model with Cluster() and decided on the optimal number of clusters with ClusterQuality(), the next step is to interpret and present the results. ClusterResults() is a small companion class that makes it easy to produce:
- Cluster membership table (important): Extract entities' cluster memberships for any number of clusters
k. - Distribution table (nice to have): Summarize how entities are distributed across clusters.
- Bar chart (nice to have): Visualize these distributions.
This ensures you can quickly link cluster labels back to your original dataset (e.g., if you have important variables such as gender and income), evaluate the balance of the cluster membership data, and prepare results for downstream analysis (e.g., index plot and state distribution plot for each cluster, and regressions).
Function Usage
A minimal example with only the required parameter (sufficient for most use cases):
cluster_results = ClusterResults(cluster)A complete example with all available parameters (for advanced customization):
# Fit a hierarchical cluster model first
cluster = Cluster(
  matrix=distance_matrix,      # square-form distance matrix (n×n)
  entity_ids=ids,              # unique IDs aligned with matrix rows
  clustering_method="average"  # linkage method
)

# Then wrap results
cluster_results = ClusterResults(
  cluster=cluster              # required: a fitted Cluster object
)

# Example usage
memberships = cluster_results.get_cluster_memberships(num_clusters=4)
distribution = cluster_results.get_cluster_distribution(num_clusters=4)
cluster_results.plot_cluster_distribution(
  num_clusters=4,
  save_as="distribution.png",
  style="whitegrid",
  figsize=(10, 6)
)
Entry Parameters
| Parameter | Required | Type | Description |
|---|---|---|---|
cluster | ✓ | Cluster | A fitted Cluster object containing linkage_matrix and entity_ids. |
What It Does
Validates that input is a
Clusterobject.Stores:
linkage_matrix(hierarchical tree of merges)entity_ids(original identifiers of rows/entities)
From there, the class provides three methods to map the tree back to interpretable cluster results.
Method 1: get_cluster_memberships(num_clusters)
Export a tidy table mapping each entity to its cluster.
Usage
df = cluster_results.get_cluster_memberships(num_clusters=4)
print(df.head())
Returns
pandas.DataFrame with two columns:
| Column | Meaning |
|---|---|
Entity ID | Original entity identifiers |
Cluster | Assigned cluster ID (1 … k) |
This table is ideal for merging back into your original dataset.
Method 2: get_cluster_distribution(num_clusters)
Summarize how entities are spread across clusters.
Usage
dist = cluster_results.get_cluster_distribution(num_clusters=4)
print(dist)
Returns
pandas.DataFrame with:
| Column | Meaning |
|---|---|
Cluster | Cluster ID |
Count | Number of entities in that cluster |
Percentage | Share of total entities, rounded to two decimals |
Method 3: plot_cluster_distribution(...)
Visualize cluster sizes as a bar chart.
Usage
cluster_results.plot_cluster_distribution(
    num_clusters=4,
    save_as="distribution.png",
    style="whitegrid",
    figsize=(10, 6)
)
Entry Parameters
| Parameter | Required | Type | Description |
|---|---|---|---|
num_clusters | ✓ | int | Number of clusters k. |
save_as | ✗ | str or None | File path to save the figure (e.g., "clusters.png"). If None, just shows. |
title | ✗ | str or None | Custom figure title. Default = "N = (number of entities)". |
style | ✗ | str | Seaborn style theme (e.g., "whitegrid", "darkgrid", "ticks"). |
dpi | ✗ | int | Resolution when saving. Default = 200. |
figsize | ✗ | tuple(float,float) | Figure size in inches. Default = (10, 6). |
What It Does
- Creates a bar plot with cluster IDs on the x-axis and entity counts on the y-axis.
- Adds percentage labels above bars for easy interpretation.
- Uses light grid lines and pastel palette for readability.
- Saves the plot to your computer disk if
save_asis provided.
Returns
None. The figure is shown or saved to disk.
Example
# Fit model
cluster = Cluster(distance_matrix, ids, "average")

# Code for ClusterQuality() is omitted here,
# but it is important to include it in your analysis.

cluster_results = ClusterResults(cluster)

# Export memberships
membership_table = cluster_results.get_cluster_memberships(num_clusters=5)
print(membership_table)

# Summarize balance
distribution = cluster_results.get_cluster_distribution(num_clusters=5)
print(distribution)

# Visualize
cluster_results.plot_cluster_distribution(num_clusters=5, save_as="distribution.png", title=None)
Output:
       Entity ID  Cluster
0    Afghanistan        1
1        Albania        1
2        Algeria        1
3        Andorra        3
4         Angola        4
..           ...      ...
189    Venezuela        1
190      Vietnam        4
191        Yemen        2
192       Zambia        3
193     Zimbabwe        5

[194 rows x 2 columns]
   Cluster  Count  Percentage
0        1     55       28.35
1        2     30       15.46
2        3     49       25.26
3        4     18        9.28
4        5     42       21.65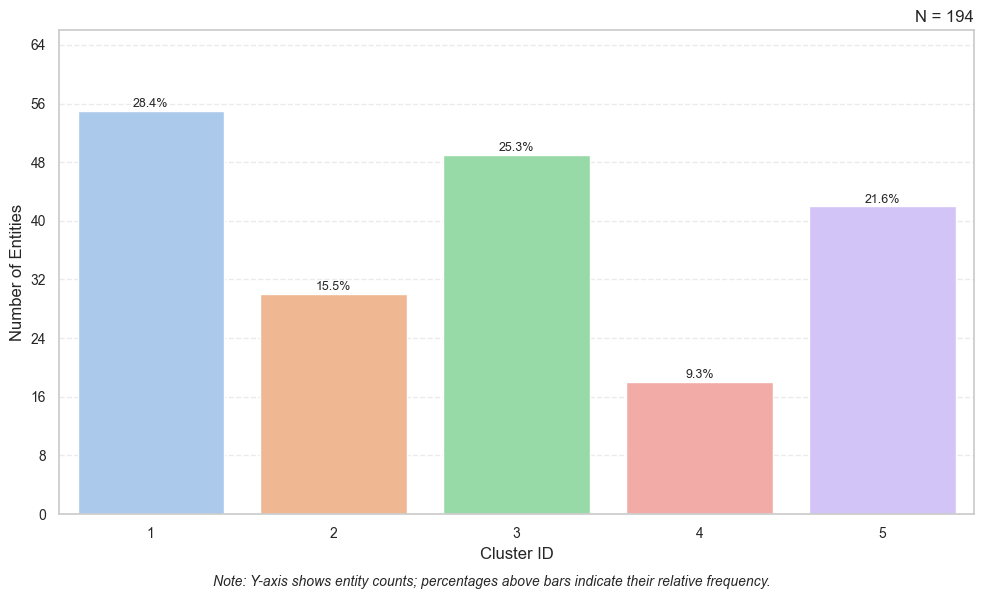
Notes and Warnings
num_clustersin this class corresponds to SciPy’stparameter infcluster(). Don’t confuse this withkin k-means as here it simply means “number of clusters.”- Always confirm that
linkage_matrixis present in yourClusterobject. Without it, membership extraction cannot proceed. - Distribution plots are best used to check balance (e.g., if one cluster dominates). For deeper evaluation, pair this with
ClusterQuality().
See Also
Cluster()andClusterQuality()are the upstream steps.- Replace Cluster ID by Labels converts numeric IDs into readable labels.
- Index Plot and State Distribution Plot visualize each cluster.
Authors
Code: Yuqi Liang
Documentation: Yuqi Liang
Edited by: Yuqi Liang, Sizhu Qu